
2026
Whereabouts
Product Engineer · Personal Project
I built this for myself while deciding between India and Australia. I was in India for a few months working remotely, and I did not want to waste that window of experimentation.
The idea
This is one of my favorite projects because it came from a real decision in my own life: India vs Australia. I was in India for a few months while working remotely, which gave me a rare chance to test what day-to-day life actually felt like instead of deciding from a distance.
I did not want to waste that opportunity by relying on vague memory later. So I built a daily system: log where I am leaning on a 1-10 scale, tag what influenced it, and write a short note. Over time, it shows me not just what I felt, but why.
What it does
I kept the product structure simple so it is easy to use every day: Log, Patterns, Past entries, and Settings.
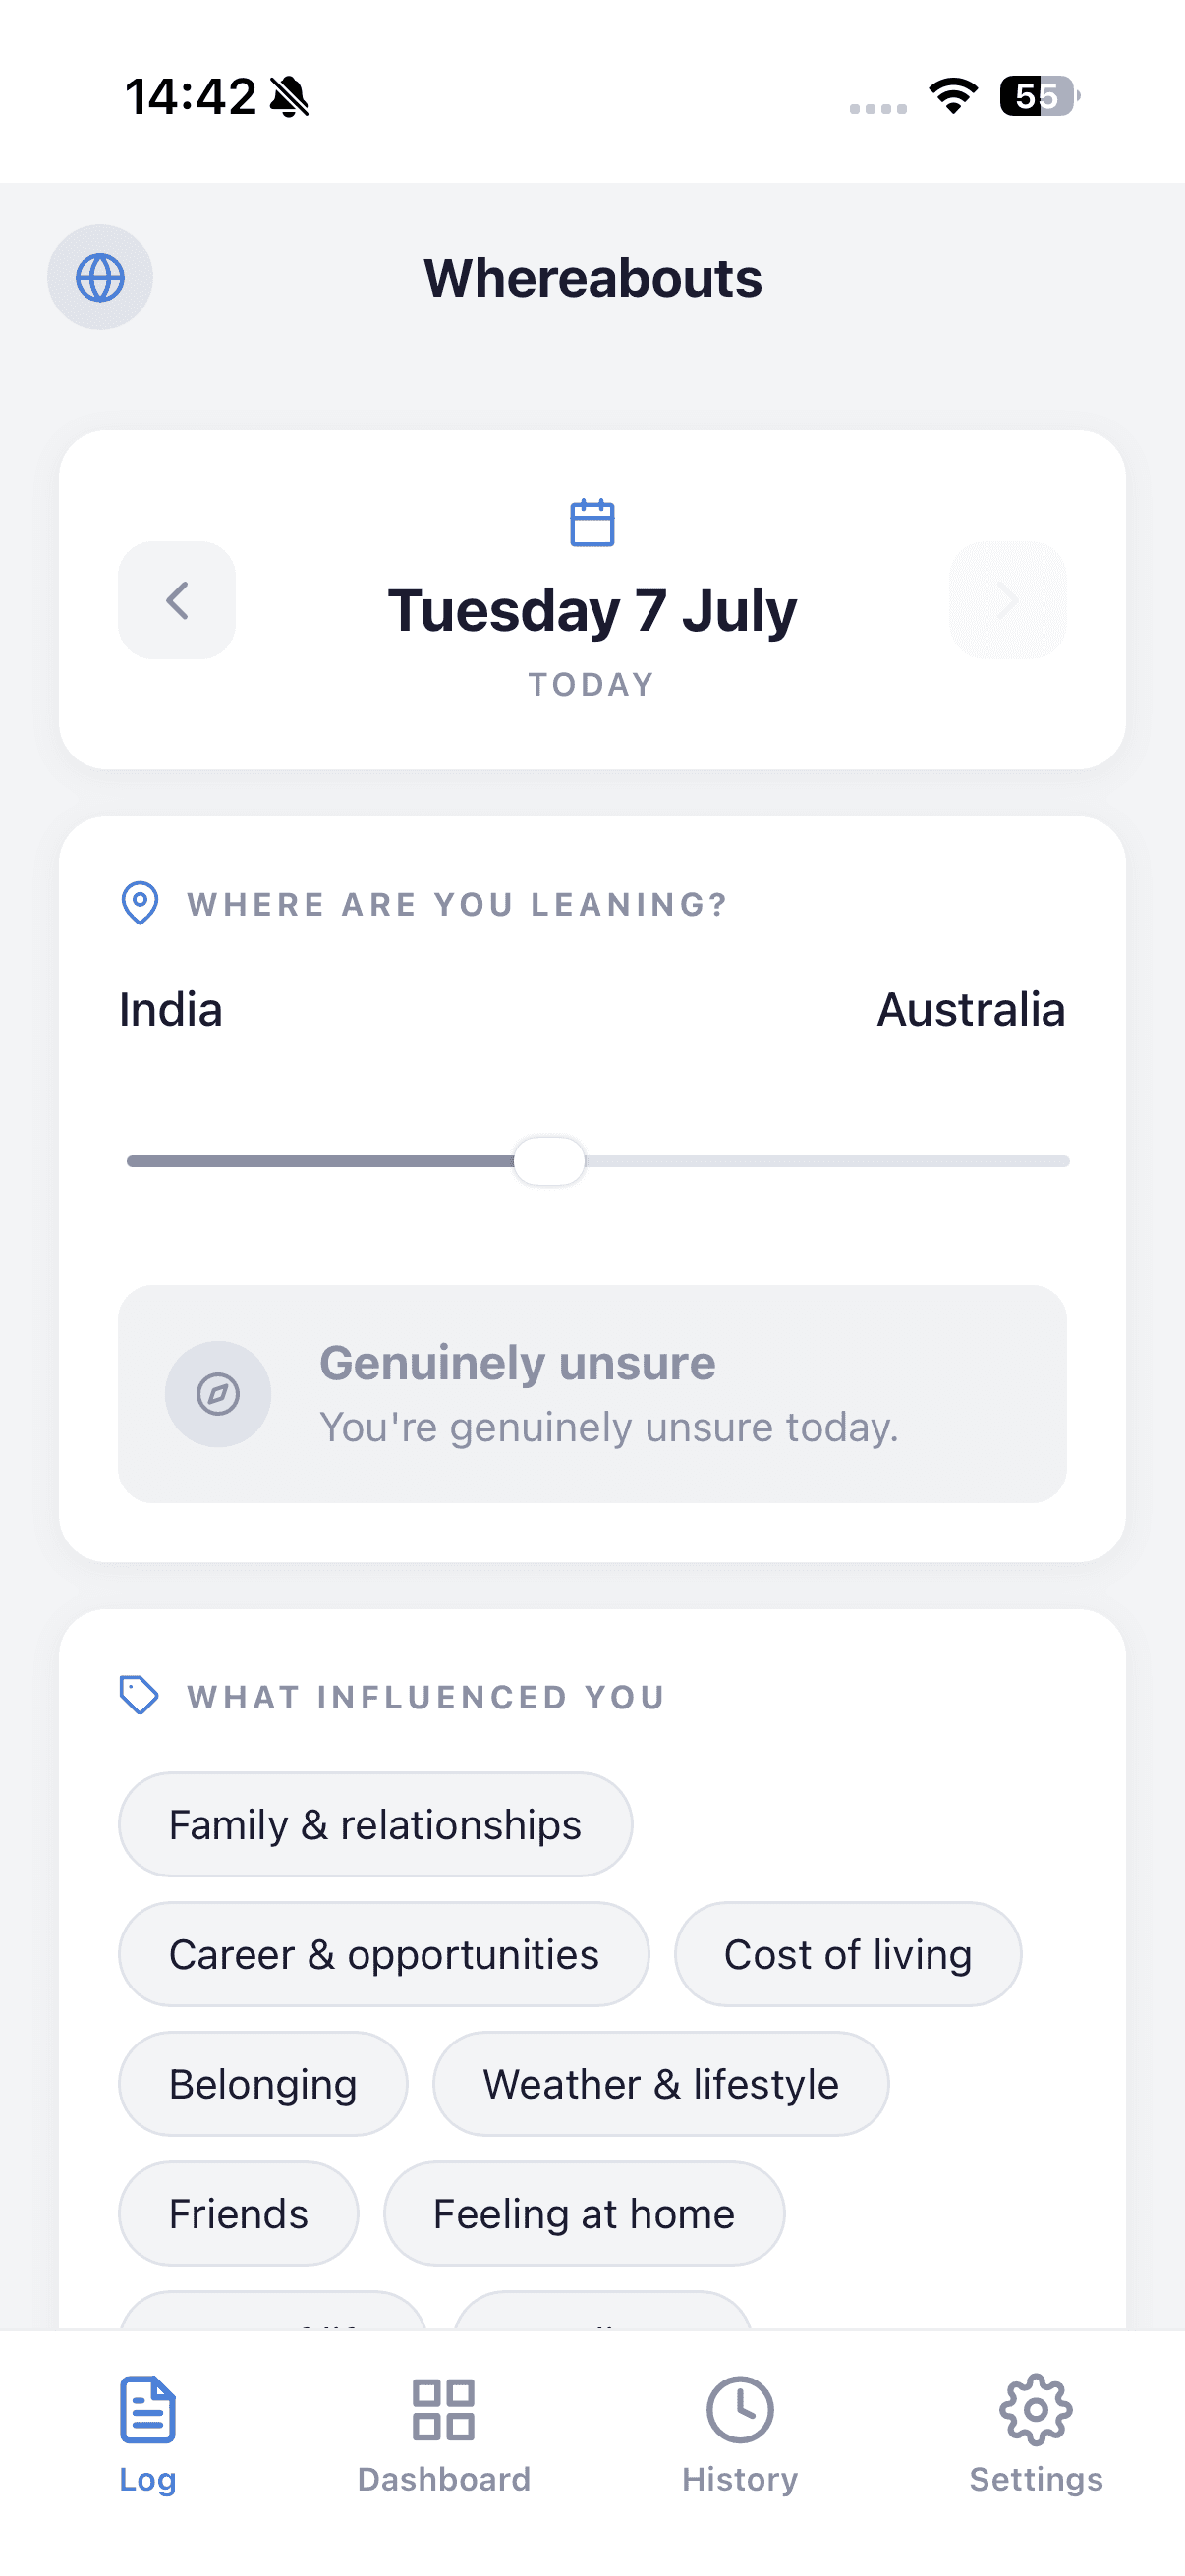
- Log: one entry per day with a lean slider, factor tags, and journal note.
- Patterns: trend charts, pivot count, and top factors influencing each direction.
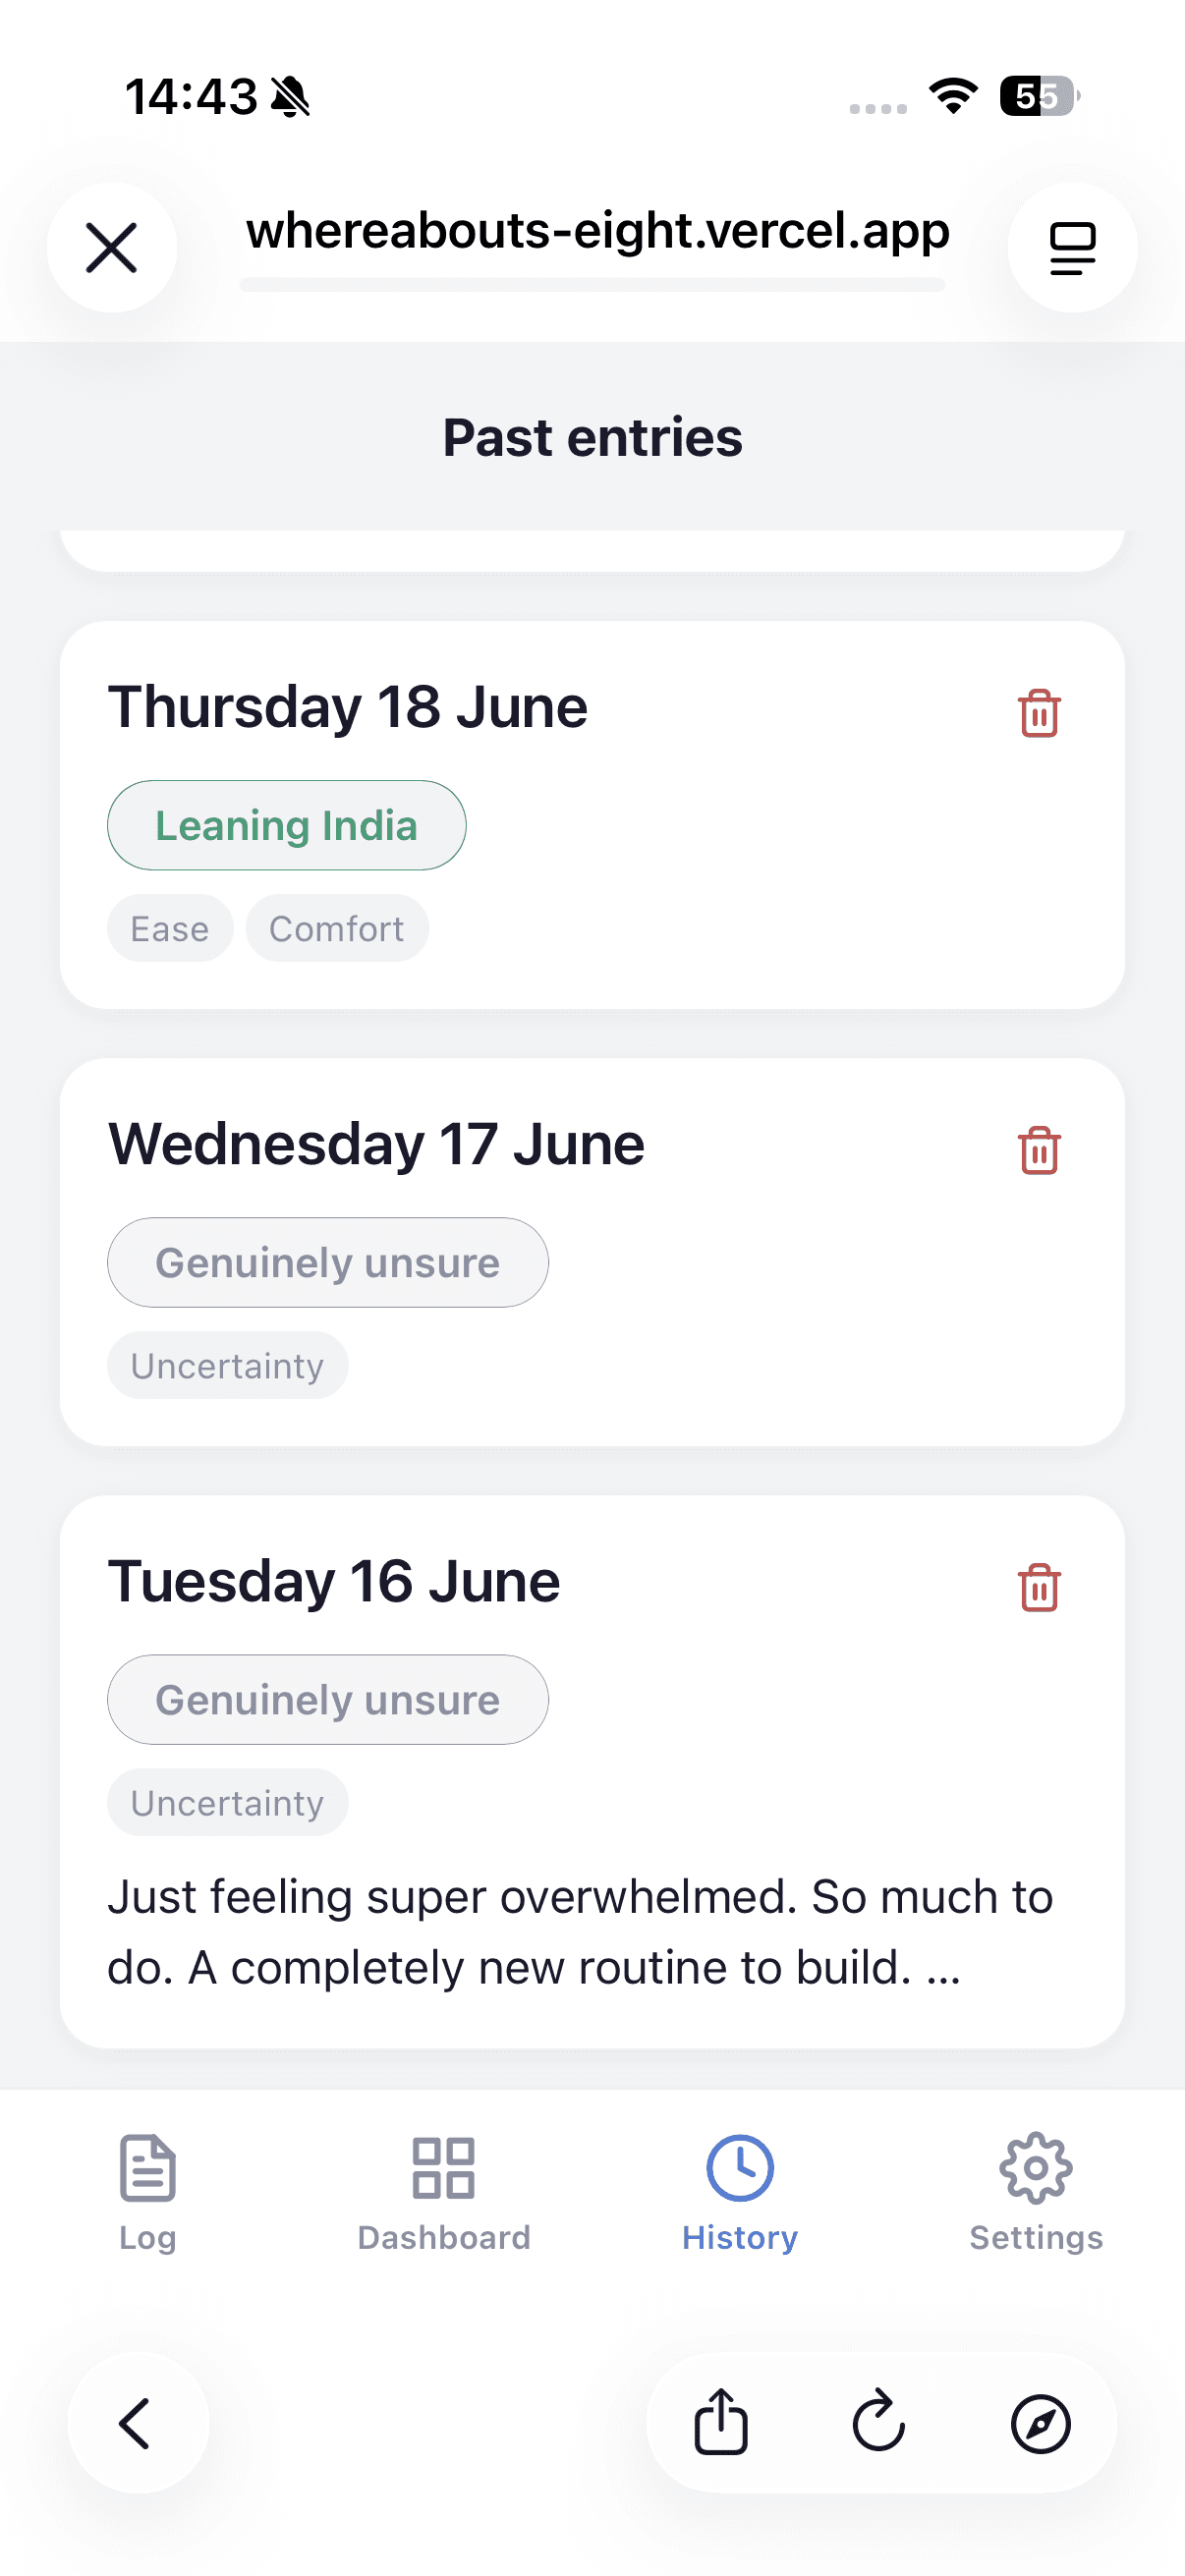
- Past entries: reverse chronological history with quick jump back to any day.
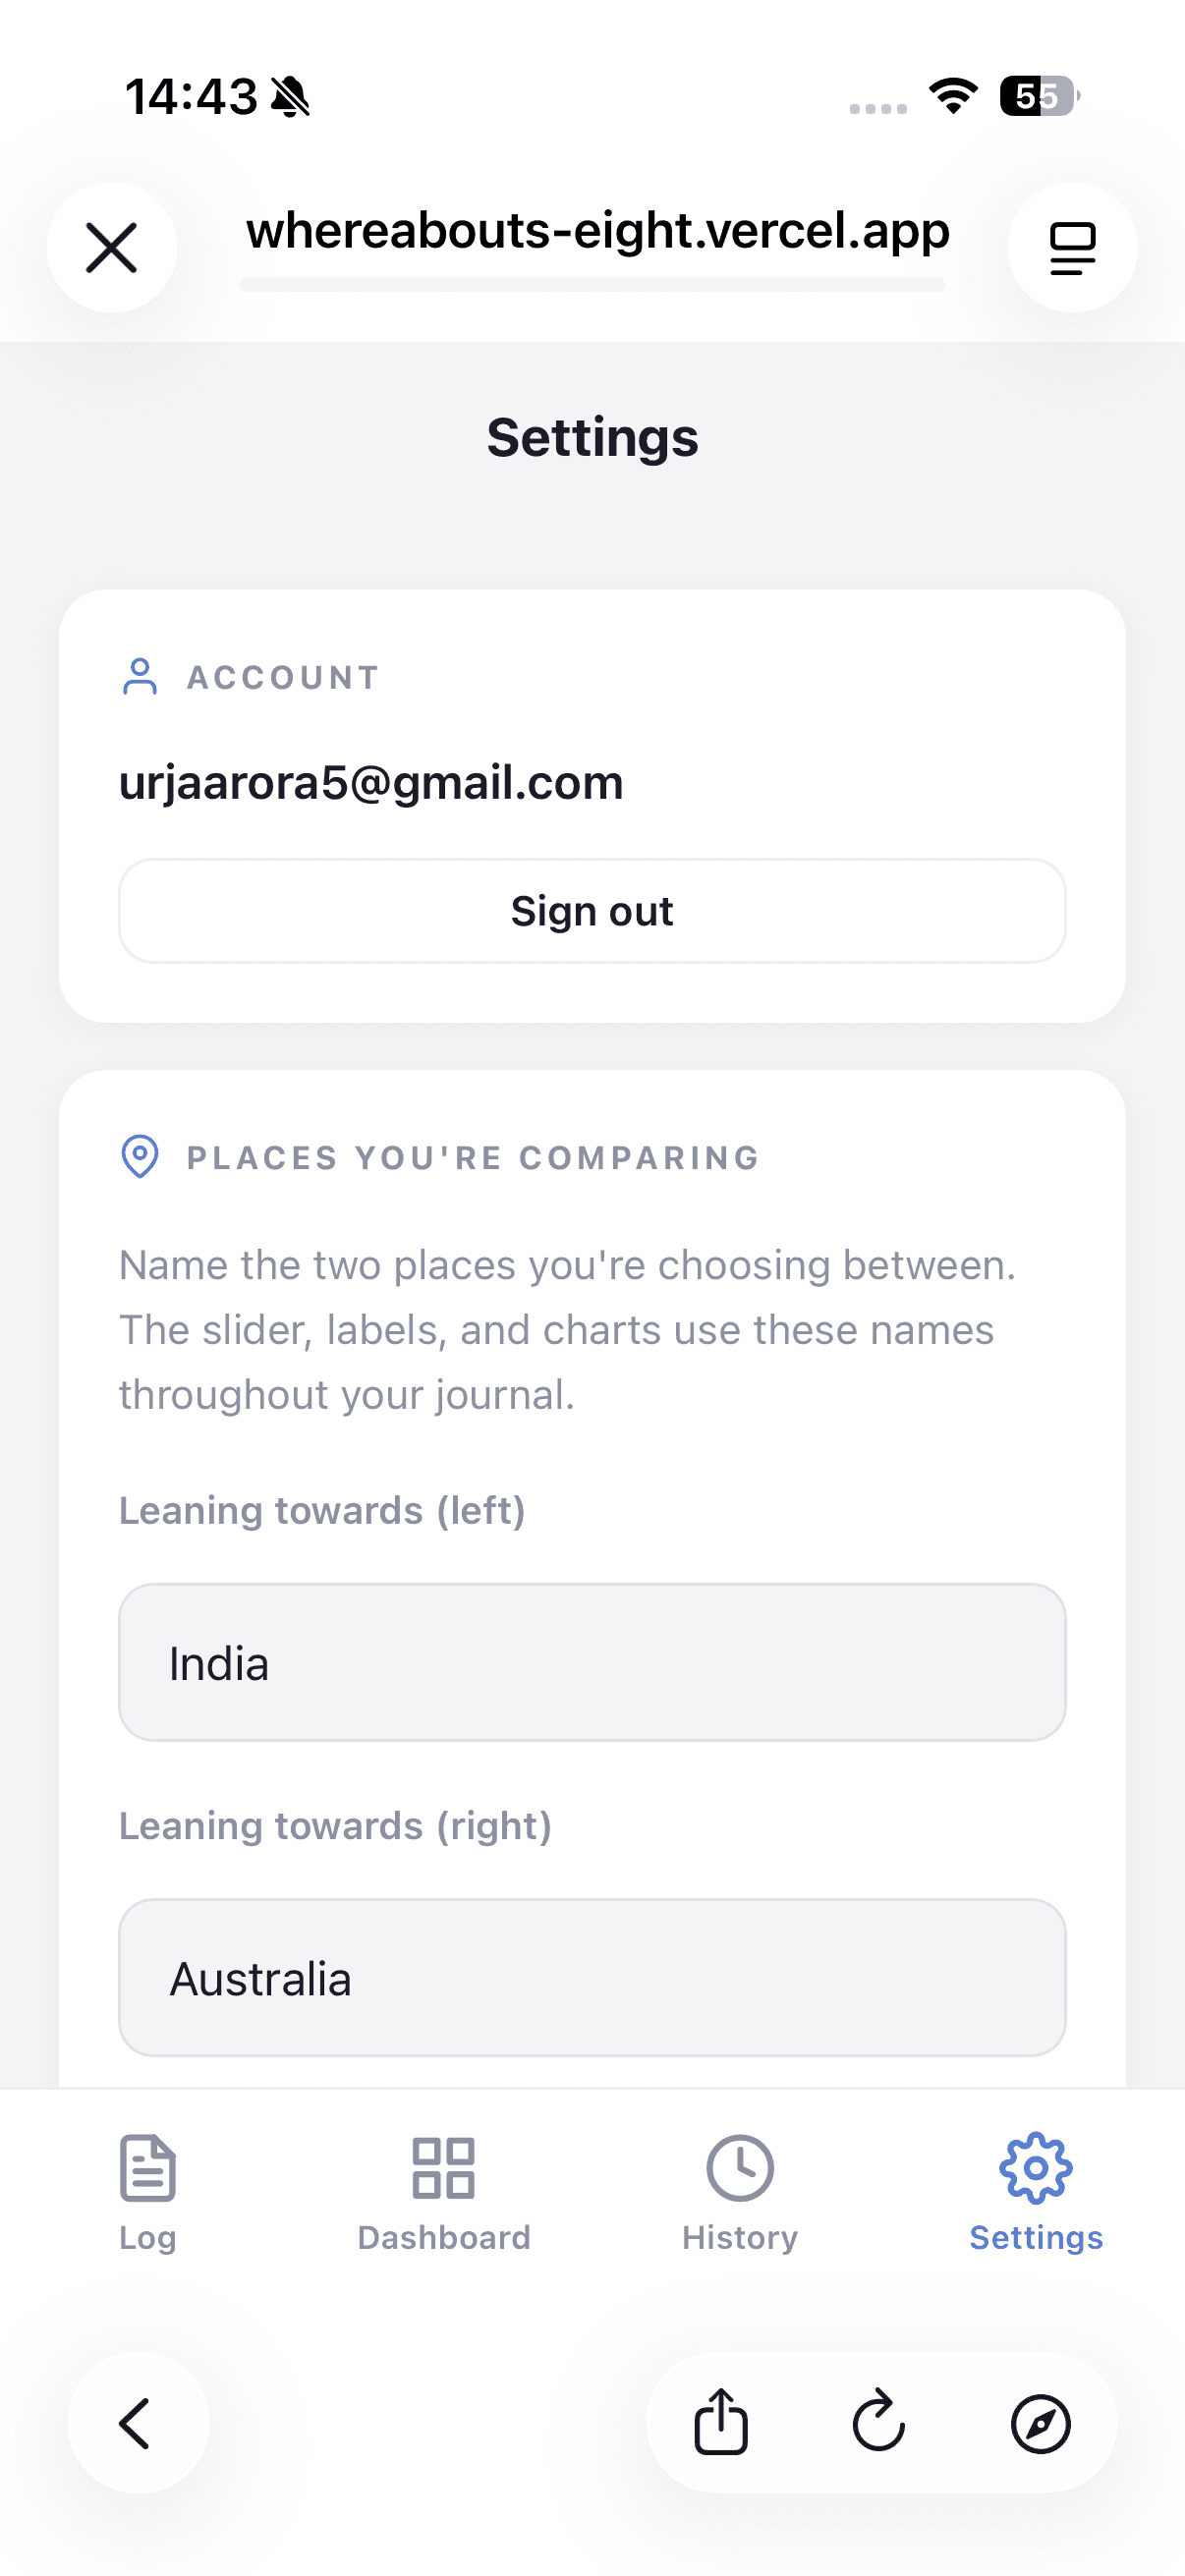
- Settings: place names, account controls, and partner sharing.
I built it around India and Australia at first, but both sides are customizable so it works for any two-place decision.
On the Log tab, I pick factor tags and write a short journal note alongside the daily lean score.
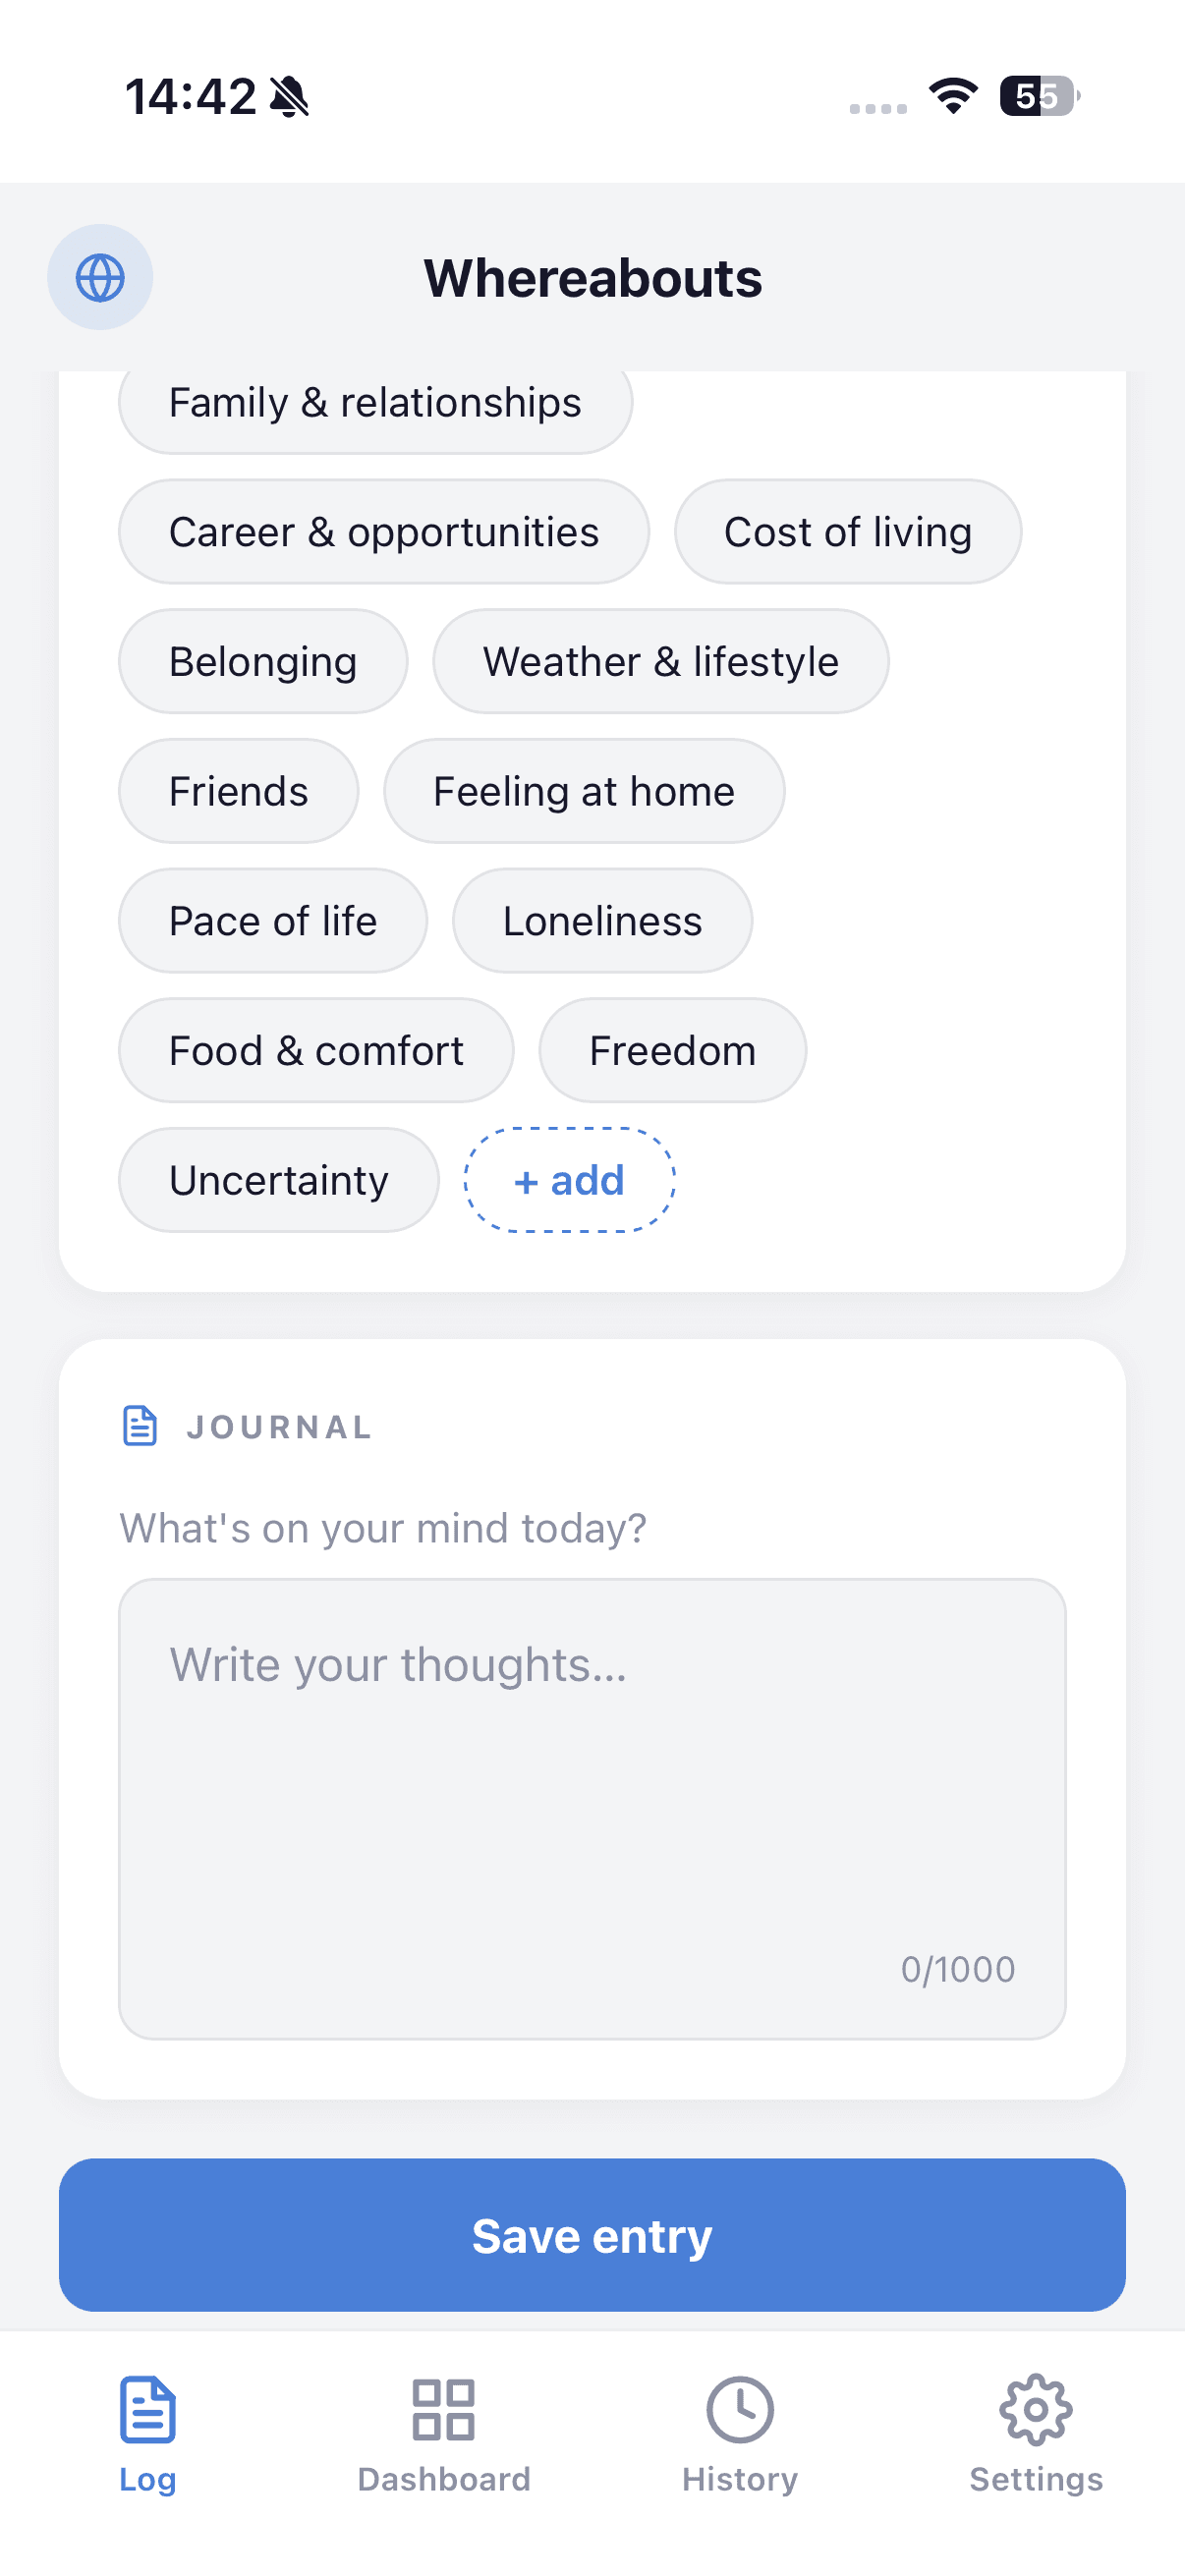
The Patterns tab is where the analysis lives: lean over time, pivot count, and how my direction shifts across days.
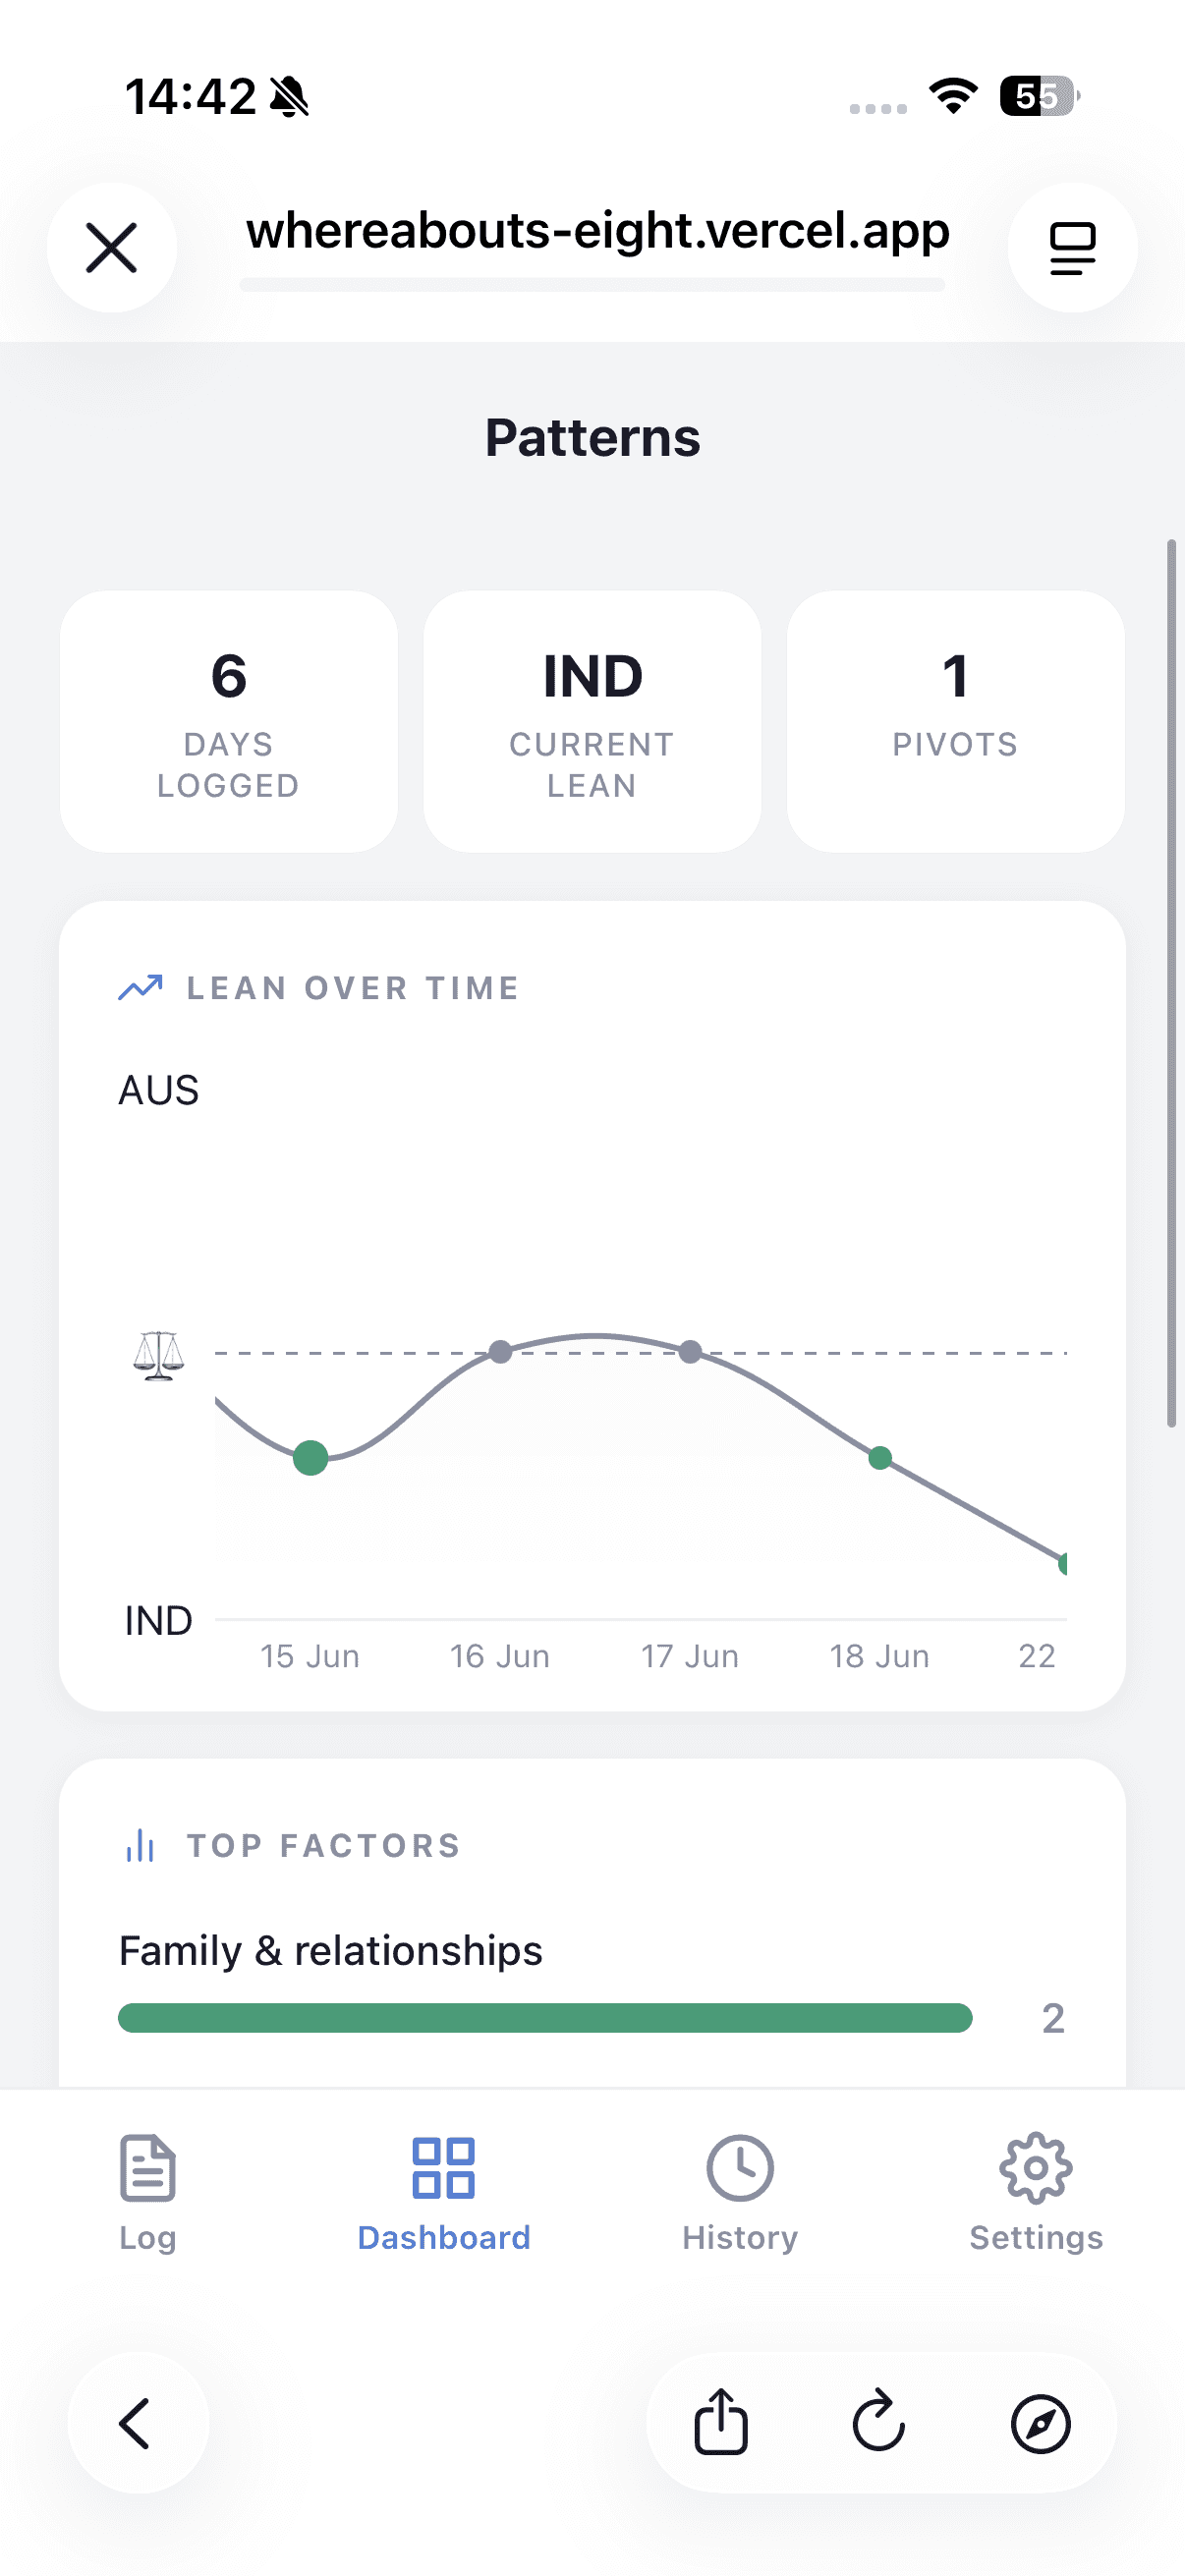
The top-factors view was important for me. It shows which tags keep showing up on India-leaning vs Australia-leaning days, so I can see what is driving my decisions instead of guessing.
Past entries keeps a reverse-chronological history so I can jump back to any day and see what I logged.
Product decisions
My main product goal was low friction. If daily logging feels heavy, people stop doing it. So I optimized for speed, clarity, and momentum.
The point was not to force a decision every day. It was to run a real experiment on myself while I had the chance, collect honest data over time, and then decide with more clarity.
- One entry per calendar day to keep the habit clear and consistent.
- Optimistic save with local cache so date switching feels instant.
- Pivot detection to show when I cross from one side to the other.
- Sharp-pivot markers for big day-over-day swings.
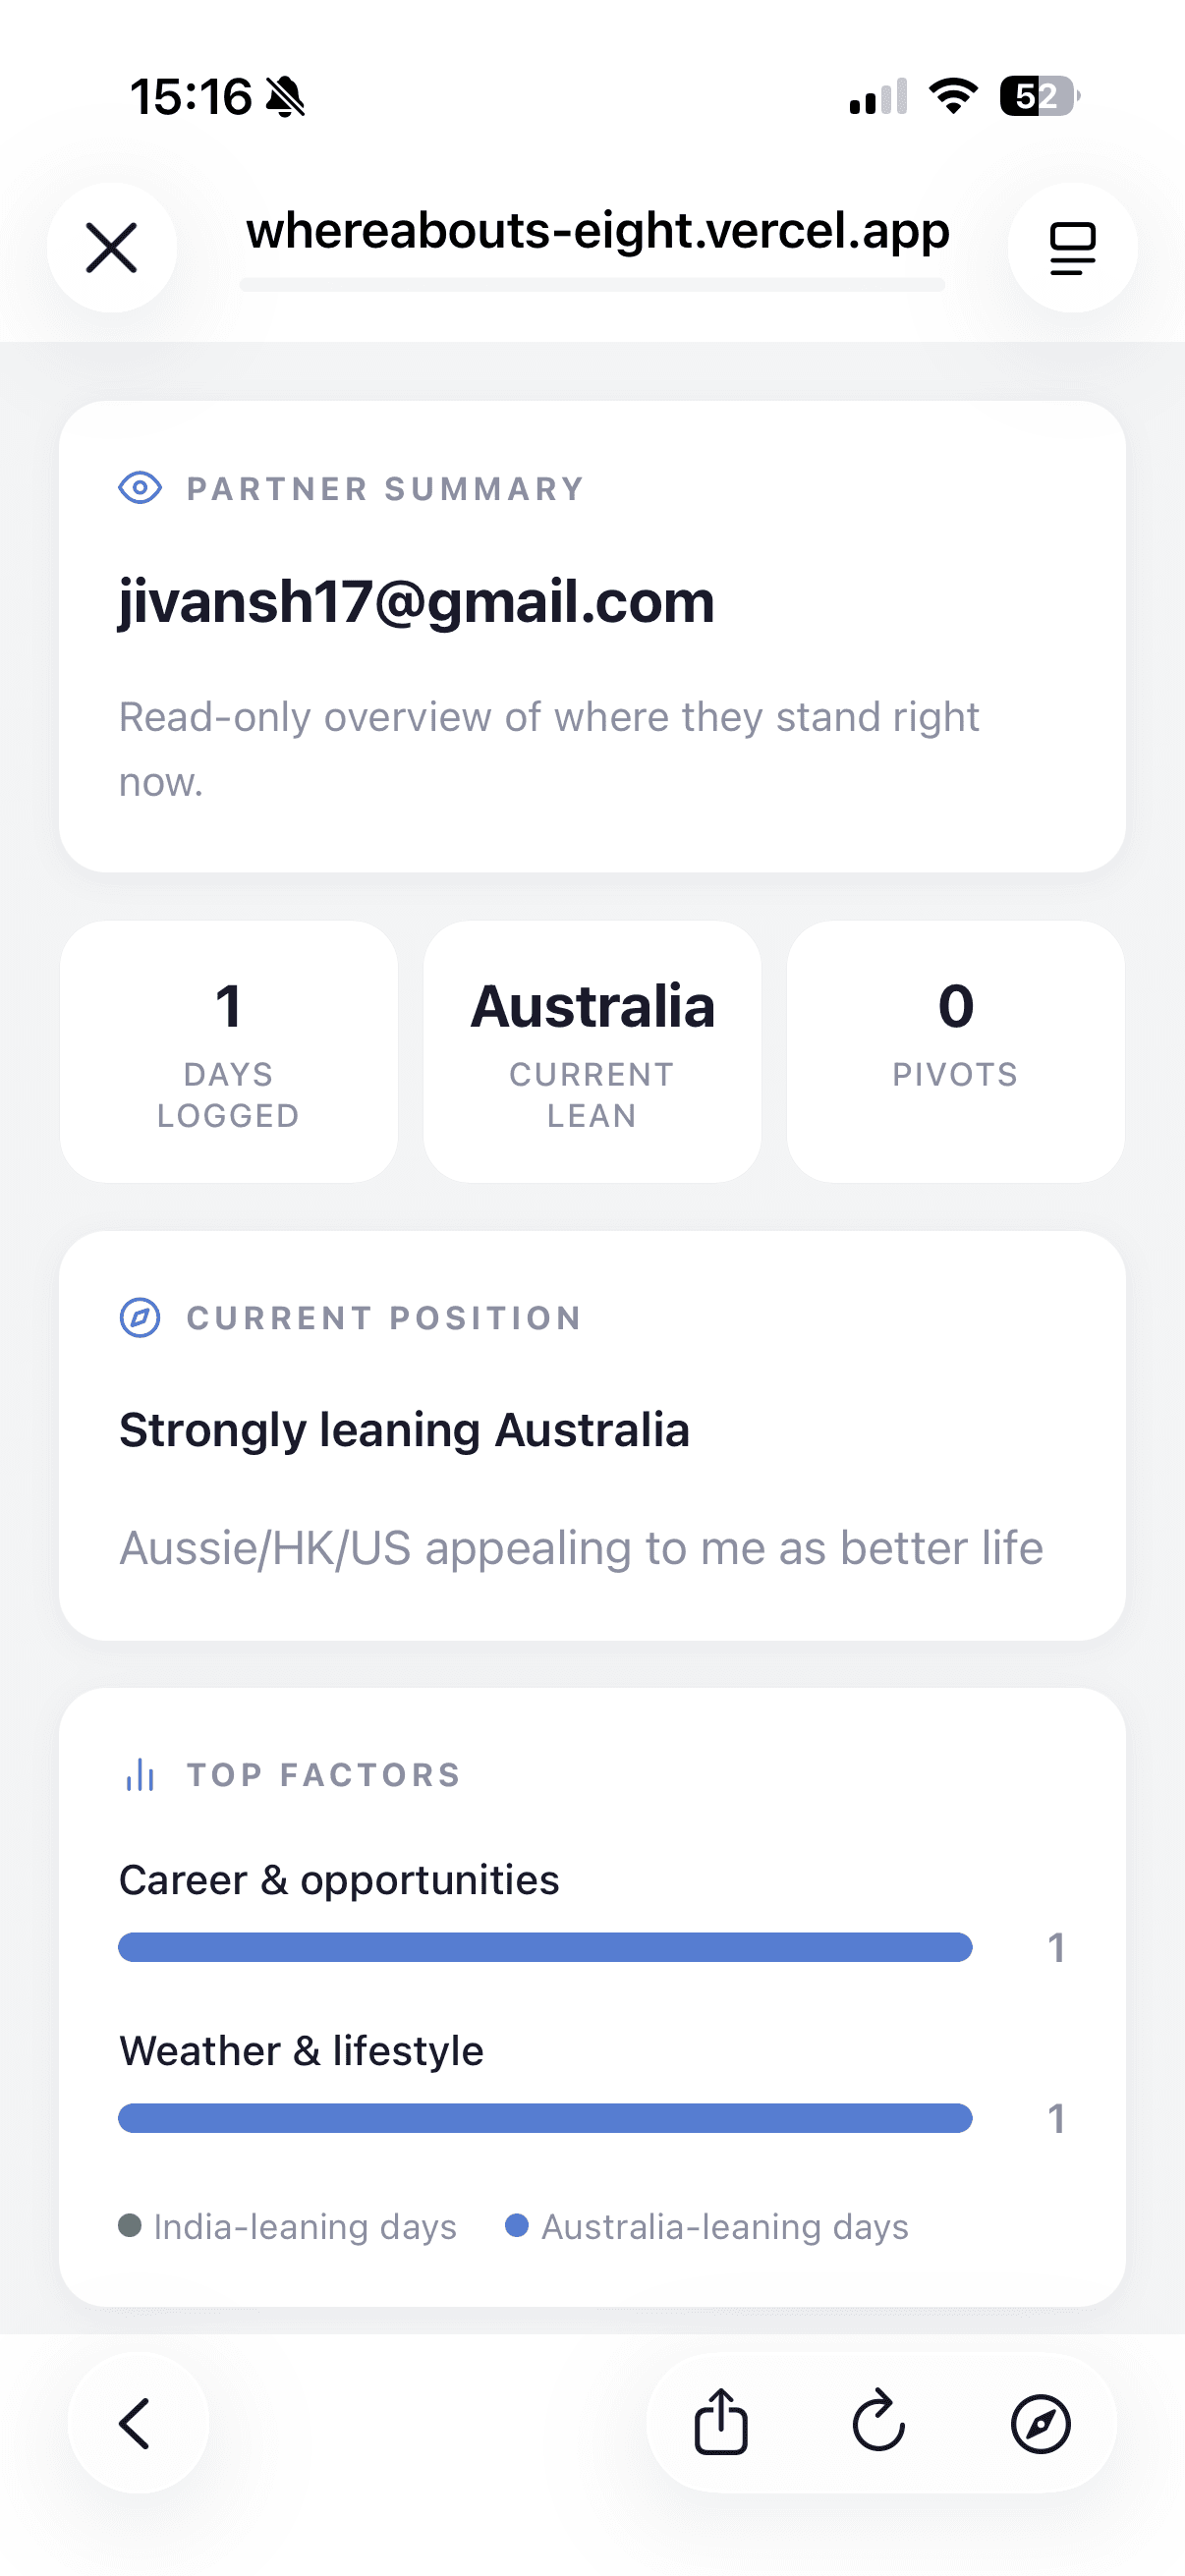
- Read-only partner mode so someone close can follow the journey without account overlap.
Partner sharing
I added partner sharing because this decision was personal and ongoing. I wanted someone close to be able to follow my progress without logging into my account or editing anything.
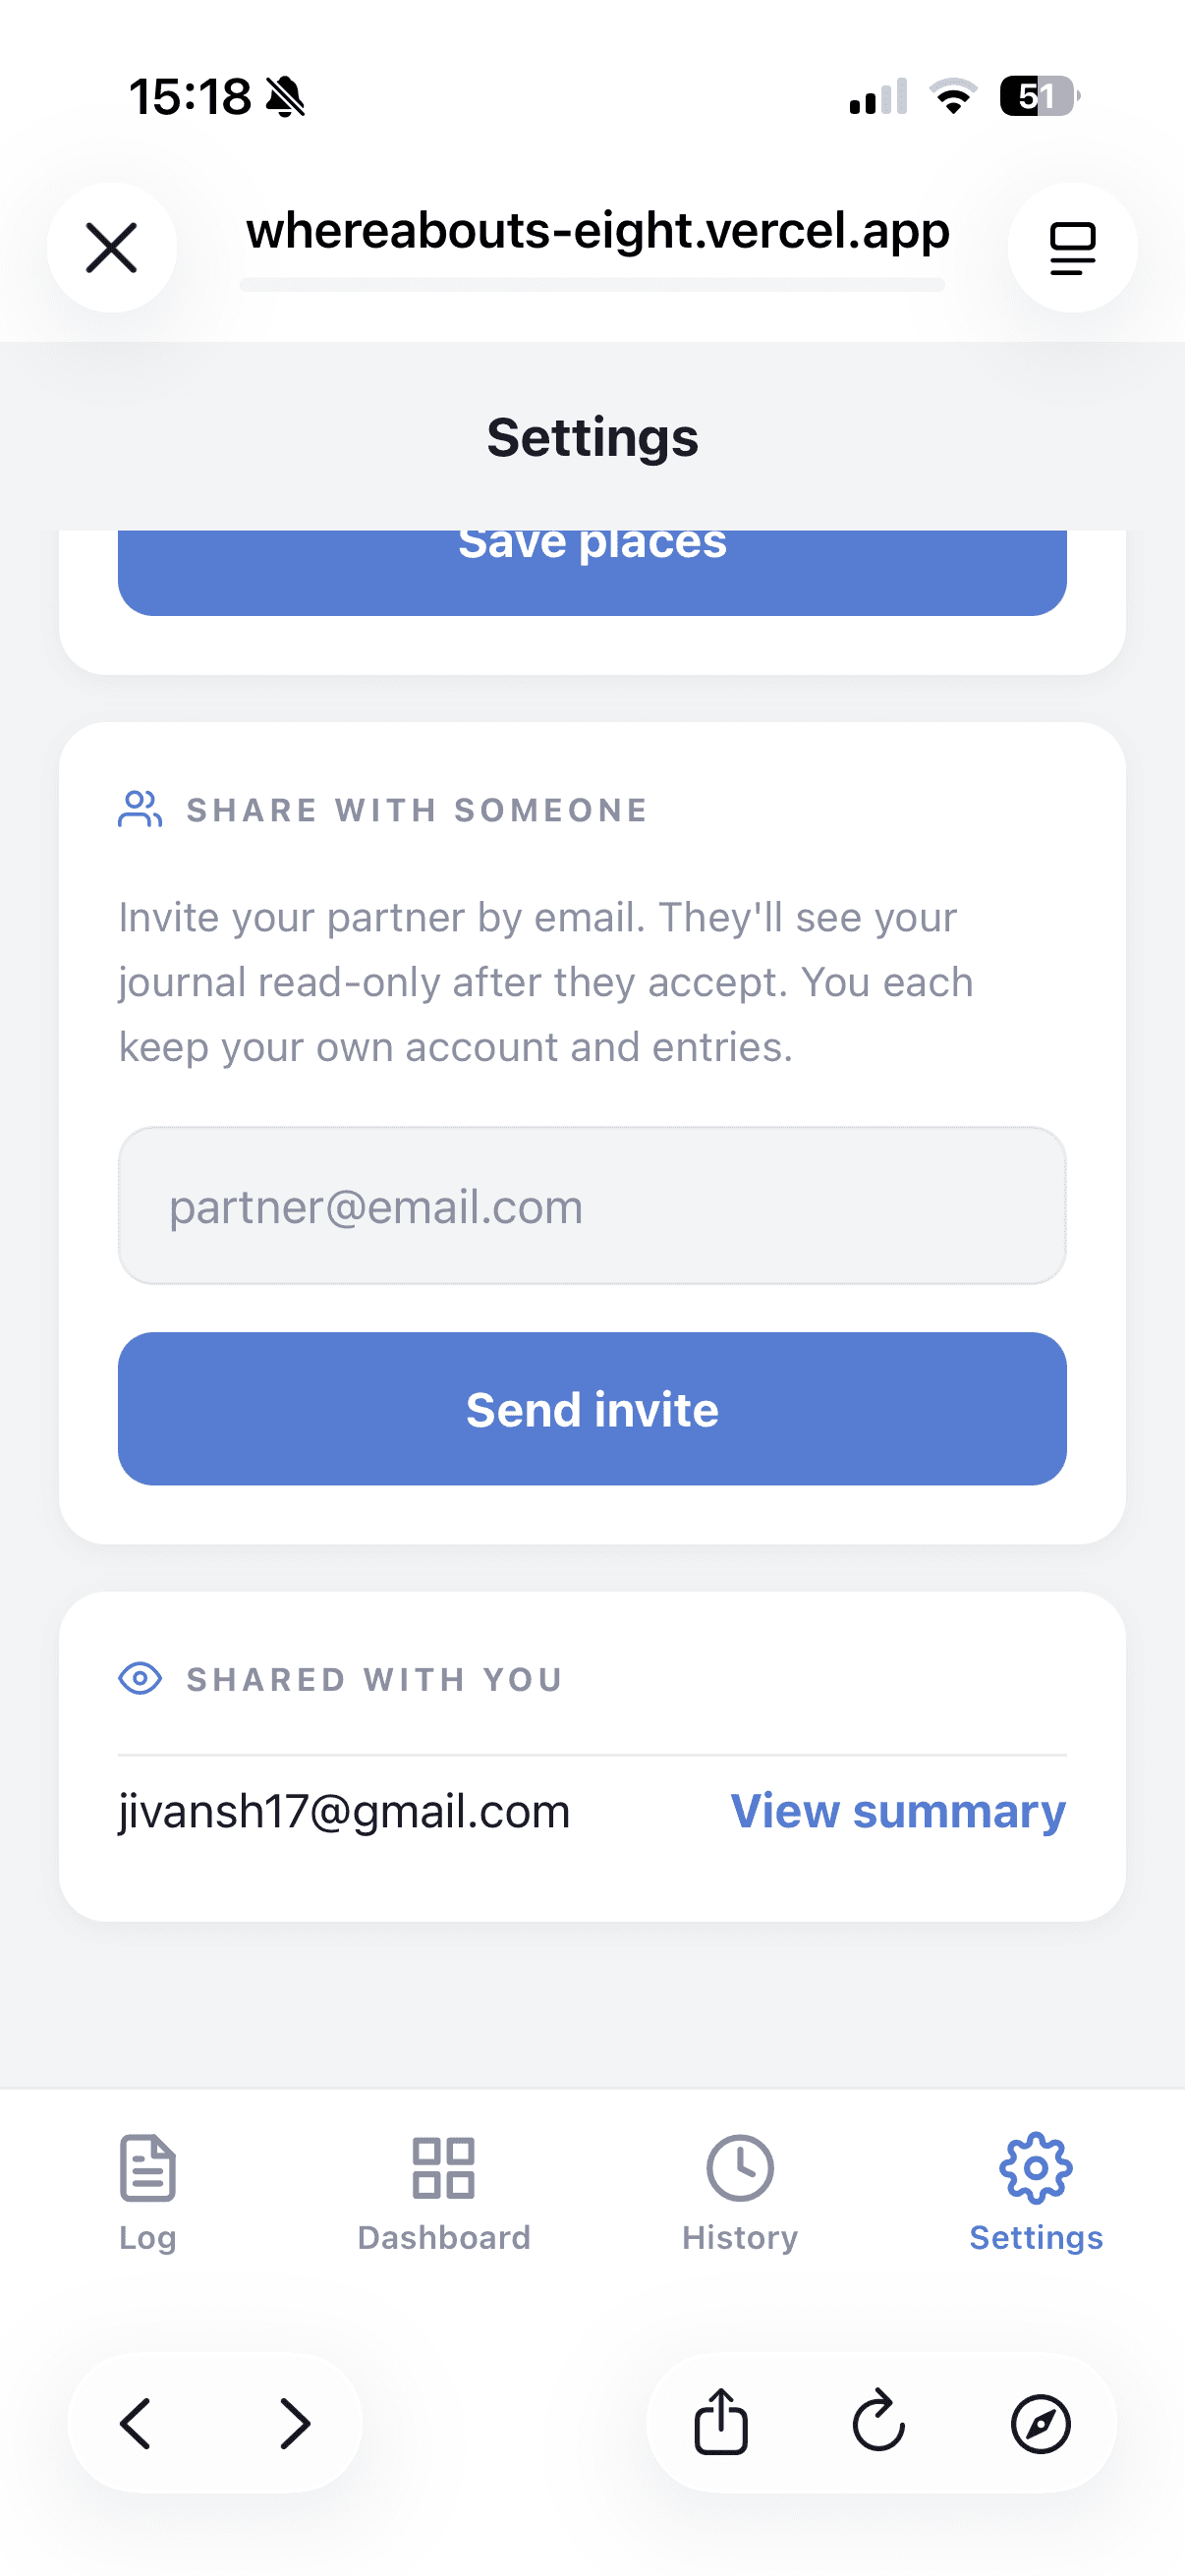
- Invite by email from Settings.
- Partner accepts the invite on their own account.
- Access is read-only, so entries stay private and unchanged.
- Partner can open a summary view with lean, pivots, and top factors.
Tech and architecture
I built this as one React Native codebase using Expo, then shipped it across web, iOS, and Android. The web version runs as an installable PWA.
- Frontend: Expo, React Native, TypeScript, Expo Router.
- Web/PWA: React Native Web static export, deployed on Vercel.
- Backend: Supabase Auth + Postgres with Row Level Security policies.
- Charts: react-native-gifted-charts for lean trends and factor analytics.
- State: React Context for auth and place configuration.
I kept security policy-driven in the database with Supabase RLS. People can access their own data, and partner access is invite-only and read-only.
What I learned
I built this because I had a real question and no good way to answer it. Turning that into a daily log, then charts, then partner sharing felt natural because each step solved something I was actually running into. That is the kind of coding I care about: start from a problem that matters, ship something useful, and keep going until it works.